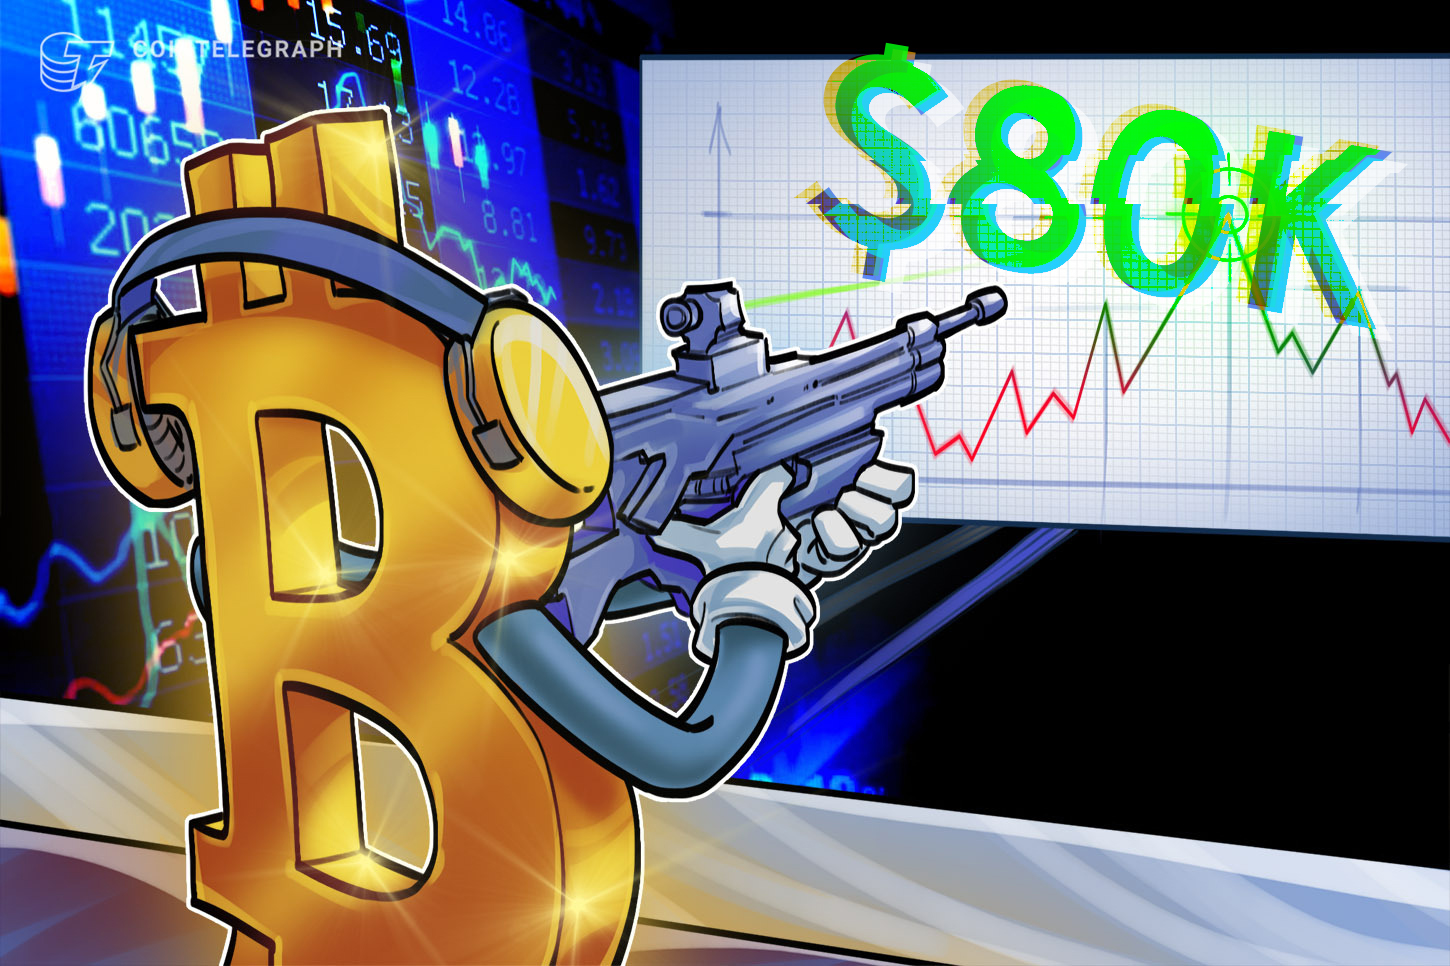
Bitcoin (BTC) extended its bullish run into the Wall Street open on Friday, rallying above $73,000. Traders now eye a move back toward $80,000 by the end of April, as several indicators point to bulls retaking control of the crypto market.
Bitcoin breaks a bearish chart pattern
On Tuesday, Bitcoin invalidated what initially appeared to be a bear pennant on the daily chart.
Related: Old Bitcoin whales sold $271M in BTC: Is crypto rally at stake?
The BTC/USD pair pierced through the pennant’s upper trend line at $70,000, jumping as much as 7% to a six-week high of $73,300 on Friday. Its breakout came alongside a rise in trading volume, implying stronger conviction behind the rally.
The price also reclaimed key support lines, including the 200-week exponential moving average (EMA, blue line), the 20-day EMA (red wave), and the 50-day EMA (orange wave) at $68,350, $69,520, and $70,580, respectively.
That simultaneously increased the odds of a symmetrical-triangle bullish reversal.
A symmetrical triangle forms when price makes lower highs and higher lows, compressing into a tightening range. It resolves when the price breaks either of the trendlines and moves by as much as the pattern’s maximum height.

In Bitcoin’s case, the measured move above the upper trend line points to $87,000, about 20% above the current price.
The bullish divergence from the relative strength index (RSI) suggests that the bullish momentum has been steadily building up over the last two months, reinforcing BTC’s upside potential.
Bitcoin’s next hurdle is the 100-day EMA (blue) near $75,400.
As Cointelegraph reported, a rejection there would weaken the breakout and raise the odds of a pullback.
Onchain data caps Bitcoin’s upside at $80,000
Data from TradingView shows that Bitcoin has spent more than six weeks consolidating within a $60,000–$70,000 range, with multiple failed attempts to sustain a strong footing above $72,000.
Glassnode’s risk indicator reveals a major resistance between the true market mean at $78,000 and the short-term holder cost basis level around $80,000.
“This is a particularly meaningful threshold,” Glassnode said in its latest Week Onchain newsletter, adding:
“Any rally into this zone is likely to encounter meaningful distribution pressure from recent buyers seeking to exit at or near breakeven.”

The chart above reinforces the view that any recovery attempt could be halted near the true market mean and the STH realized price, as seen in 2023.
Glassnode’s Entity-Adjusted UTXO Realized Price Distribution (URPD), which shows at which prices the current set of BTC UTXOs was created, also revealed that BTC price has entered a relatively open zone between $72,000 and $82,000, where there’s less resistance.
This means BTC may move more freely in the short term within this range, if the momentum holds, with the upside possibly capped at $82,000-$85,000. This is where investors acquired more than 1.3 million BTC.

Meanwhile, BTC’s cost-basis distribution heatmap shows a pronounced accumulation between $78,000 and $84,000, suggesting a potential short-term pathway toward this level.
Polymarket odds for $80,000 BTC in April rise
Polymarket, a crypto-based prediction market where users trade contracts on real-world outcomes, is showing a clear bullish shift for Bitcoin in April.
Traders now assign 26% chances that BTC/USD reaches $80,000 in April, a 5% increase over the last 24 hours. The $75,000 target carries even stronger convictions at 76%.

At the same time, the odds of the BTC price reaching $65,000 in April are priced lower than before, suggesting the crowd is trimming its downside expectations.
This article is produced in accordance with Cointelegraph’s Editorial Policy and is intended for informational purposes only. It does not constitute investment advice or recommendations. All investments and trades carry risk; readers are encouraged to conduct independent research before making any decisions. Cointelegraph makes no guarantees regarding the accuracy or completeness of the information presented, including forward-looking statements, and will not be liable for any loss or damage arising from reliance on this content.