


Ethereum breaks out of key patterns and retests support, with analysts tracking signs of a possible rally toward $8K as 2025 unfolds.
Ethereum is showing strong technical signals that may point to a major upward move. Several analysts are tracking key patterns, support levels, and price zones that have historically preceded large rallies.
With ETH now holding above important levels, focus is shifting to whether momentum will continue through the end of the year.
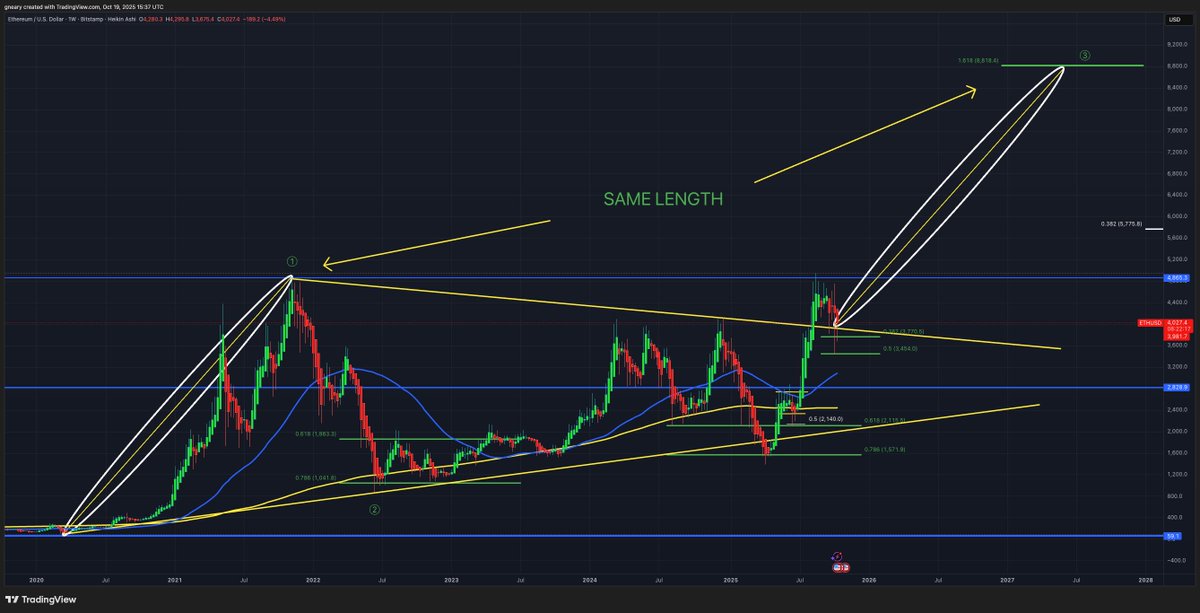
Monthly Breakout Points to Higher Targets
Crypto trader Merlijn The Trader posted a monthly chart showing Ethereum breaking out from a long-term pennant, which formed after ETH’s run to its 2021 peak near $4,800 and years of sideways movement inside a tightening range. The breakout above this pattern suggests new bullish momentum.
The analyst called it “the most explosive setup since 2017,” with a potential path toward $8,000–$8,500. The asset has already moved above the pennant’s resistance, and current momentum appears to be in line with previous market cycles. Ethereum is trading around $4,100 at press time, showing a 4% gain in the past 24 hours.
Moreover, a separate chart from EtherNasyonaL compares Ethereum’s current movement to past cycles. In both 2016 and 2020, ETH retested a key demand area before rallying. The same behavior appears to be happening again in 2025. They noted,
ARE NOT BULLISH ENOUGH ABOUT $ETH.
In the 1st and 2nd cycles, Ethereum tested the major demand zone before going parabolic.
Today, the same scene is being re-enacted.
The difference is that most people still leave the theater before the curtain rises. pic.twitter.com/0l92xFNtht
— EᴛʜᴇʀNᴀꜱʏᴏɴᴀL 💹🧲 (@EtherNasyonaL) October 19, 2025
Notably, the demand zone has held, and the price has rebounded from that area. The pattern is consistent with how ETH moved in earlier bull markets.
You may also like:
Support Retest After Breakout Holds for Now
According to The Long Investor, Ethereum recently broke out of a multi-year wedge and is now retesting the top of that wedge as new support. For the past three weeks, ETH has traded in the $3,700–$3,900 range, holding just above that line.
The trader believes ETH has 10 days or less to stay above this level to confirm the breakout. If support holds, the move could mirror Ethereum’s rally in 2020, which followed a similar breakout and support test. The chart suggests a price target of around $8,200 if the structure continues to hold.
Momentum Mixed as MVRV Turns Lower
Analyst Daan Crypto Trades shared that ETH is testing both the 0.382 Fibonacci level and the daily 200 EMA. He noted,
“I would want to see this back above those previous cycle highs at $4.1K to get the momentum back in favor of the bulls.”
Holding that area could give the price the push needed to continue higher.
However, another view comes from Ali Martinez, who pointed to a warning signal from the MVRV Momentum indicator. The 160-day MVRV line has crossed below its moving average, a move that last occurred before ETH dropped from $3,300 to $1,400. That same pattern just returned, raising concern about a possible short-term pullback.
Binance Free $600 (CryptoPotato Exclusive): Use this link to register a new account and receive $600 exclusive welcome offer on Binance (full details).
LIMITED OFFER for CryptoPotato readers at Bybit: Use this link to register and open a $500 FREE position on any coin!